
Filtering runs
Use the status filters to narrow the list:- All: show all runs
- Queued: waiting to start
- Running: currently executing
- Completed: finished successfully
- Failed: encountered an error
- Review: paused for human review
- Cancelled: manually cancelled
- Awaiting Children: waiting for child runs from document chunking to complete
Run detail
Click a run to view its execution details. The run detail page shows:Step timeline
A visual timeline of each pipeline step and its status. Steps are shown in execution order with timestamps.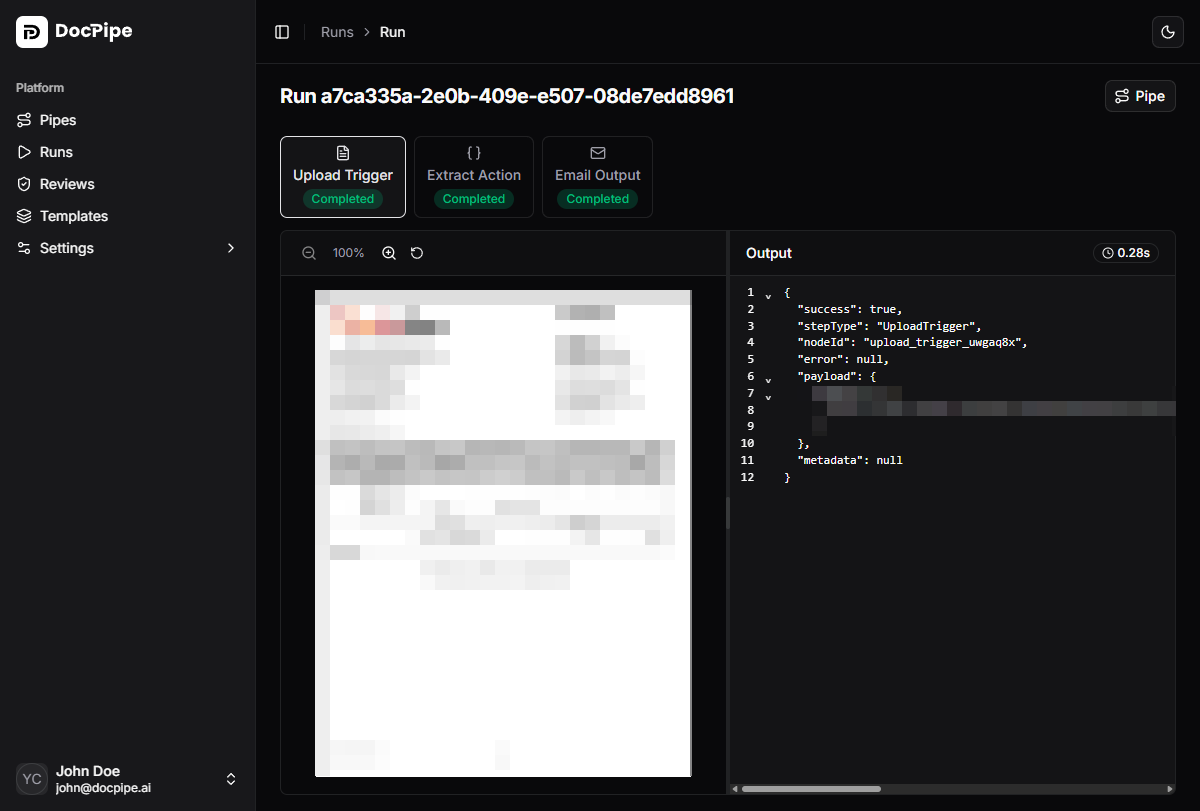
Step data
Click a step in the timeline to inspect:- Input: data received from the previous step
- Output: data produced by this step
- Errors: error details if the step failed
- Timing: start time, end time, and duration
Callback history
If the pipeline includes a callback output node, the run detail page shows a Callback History panel. This displays each callback attempt with:- URL — the webhook endpoint that was called
- Status code — the HTTP response status
- Success/Failure — whether the callback was delivered successfully
- Attempt number — callbacks are retried on failure
Run actions
- Cancel: stop a running or queued run
- Link to pipe: navigate to the parent pipe
- Link to file: navigate to the source file